
Those Dubious Exchanges, Coinbase lists XRP, & Bears Back in Control 🐻
Analysis on the latest price movements, research, and significant shufflings in the crypto space.
Welcome to newsletter numero uno! This will be a weekly release where we take a dive into the latest developments and price movements taking place in crypto. Let the dive begin…
Key Developments – Coinbase Lists XRP, Net Effect Close to Zero

It has been one week since Coinbase announced that they will be listing XRP and what has the net effect been? A one measly percent increase…
Expectations for Coinbase listing XRP have been building since as early as 2017. XRP did increase 14% on the announcement but it was a poor performance given the lambo and moons that the #XRPArmy were expecting upon listing. After the initial increase, price starting reversing and is now almost back to where it was prior to the announcement.
We were shocked to hear that Coinbase did actually decide to list XRP. In their digital asset framework which they use to match potential listing assets up against, the XRP blockchain seems to go against some of the key criteria.
Decentralization is one of the first mentioned criteria and the level of decentralization the XRP blockchain is questionable to put it mildly. XRP also seems to be a bad match for other criteria on the list such as legal and compliance. XRP still has a questionable status in terms of whether it is a security.
Interesting Bits 🤓
CoVenture release research report.
CoVenture – an alternative asset manager with a division dedicated to crypto – have released a research report examining the question of how liquid cryptocurrency exchanges really are. The research found that up to 99% of the reported volume of some exchanges is likely to be fake news due to shady business models and practices such as wash trading and transaction fee mining (see below for description 😉). The main culprits where the volume figures weren’t making sense were Bithumb, ZB, CoinBene, EXX, and FCoin. Some of the exchanges that are likely reporting 100% legitimate figures include Kraken, Binance, and Coinbase.
The report also included a number of other interesting findings 🤔. While research spanning from 2011 to 2016 found that volume-based trading strategies worked some of the time, more recent research has shown that the relationship between volume and price performance has broken down completely. USD Tether issuance is another thing which is monitored by traders and is often cited to be linked to price performance. The research here has also found this to be fake news and shows no statistical link between tether issuance and price performance.
You can find the full research report here.
Price Analysis – The Bears are Back

The candle for the last month closed with the first gain since July. The week was looking likely to close strongly two weeks ago with price trading at several key points but the bears took back control.
Price managed to rise above the 50 EMA two weeks ago but a failure to close above resulted in this not meaning diddly squat. The monthly RSI is trading near all-time-lows and another wave of selling may result in us seeing the most oversold levels in bitcoin ever.
The monthly MACD is approaching its centerline to the downside. This is lagging indicator so it reflects the downward movements we have aleady been seeing in price but a downward crossover is typically taken as a bearish sign by analysts.

On the weekly chart, price has been forming a series of higher lows and lower highs. Both together are resulting in the consolidated price action we are seeing now.
Price is also trading between two different moving averages. The 200 EMA (‘in red above) has now twice provided resistance and the 200 SMA (in black above) has now twice provided support. A break and close below the 200 SMA could result in a sharp sell-off.
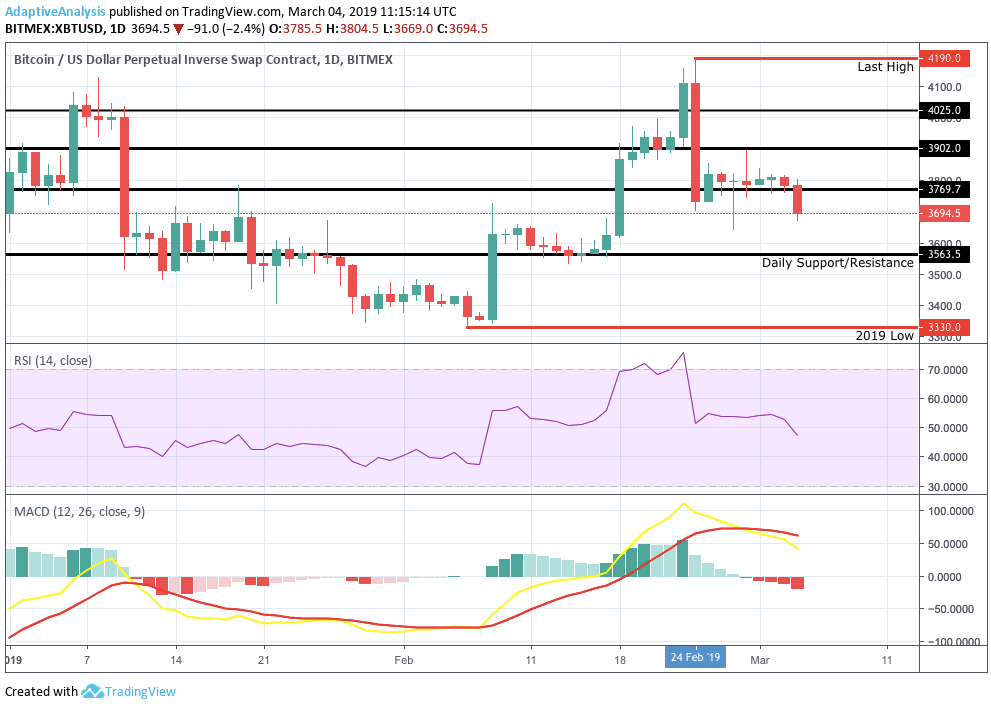
We are seeing a sell-off to start off this week. Bears 1 – Bulls 0 so far this week.
Much of last week was consolidated price action. Moves towards resistance at $3902 were quickly sold off and the $3769 support was being tested repeatedly. Numerous tests tend to make a level weaker with less buyers to hold the level on each test. With price breaking below the level to start off this week, the next level we will be looking at is $3563.
Knowledge Gainz 💪
What is that transaction fee-mining we talked about earlier?
Essentially, transaction fee mining is a shady business model applied by exchanges whereby whereby users are rebated exchange fees in the exchange's native token, sometimes in excess of the fees that they paid. For example, fees paid in crypto or fiat may be rebated 120% in the exchanges own native token. The model is highly questionable and is typically used to artificially drive up volume figures.
That’s a Wrap…
If we missed out on anything or there is anything you want discussed in the next newsletter, tweet at us on @AdaptiveIO. Don’t forget to subscribe to get the analysis straight to your inbox 😉.
Disclaimer: Nothing in this newsletter constitutes financial or investment advice. You are completely responsible for your own decisions, obviously. Read full disclaimer here.